Revenue Trends
- State funding has not kept pace with rising costs, unfunded mandates, and growing expectations.
- All school districts rely on school levies to make up for inadequate state funding.
- Over 73% of districts have voter-approved operating levies.
- The disparity in operating levies can range from $0 to over $2,929 per pupil, leaving many students without the educational opportunities they need and deserve.
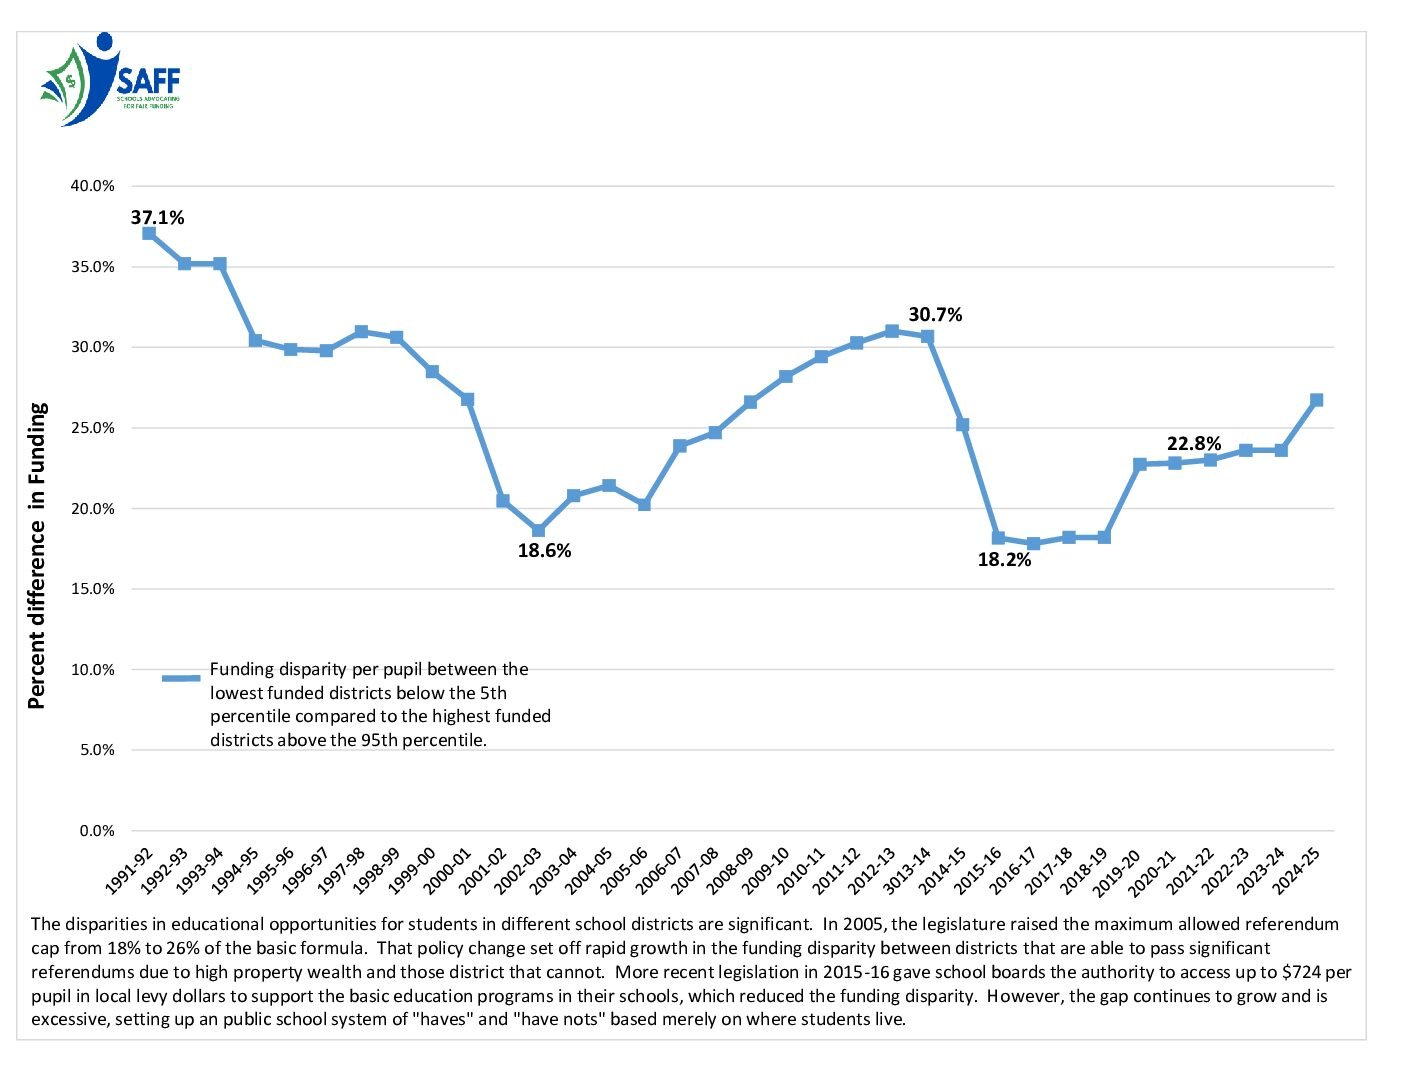
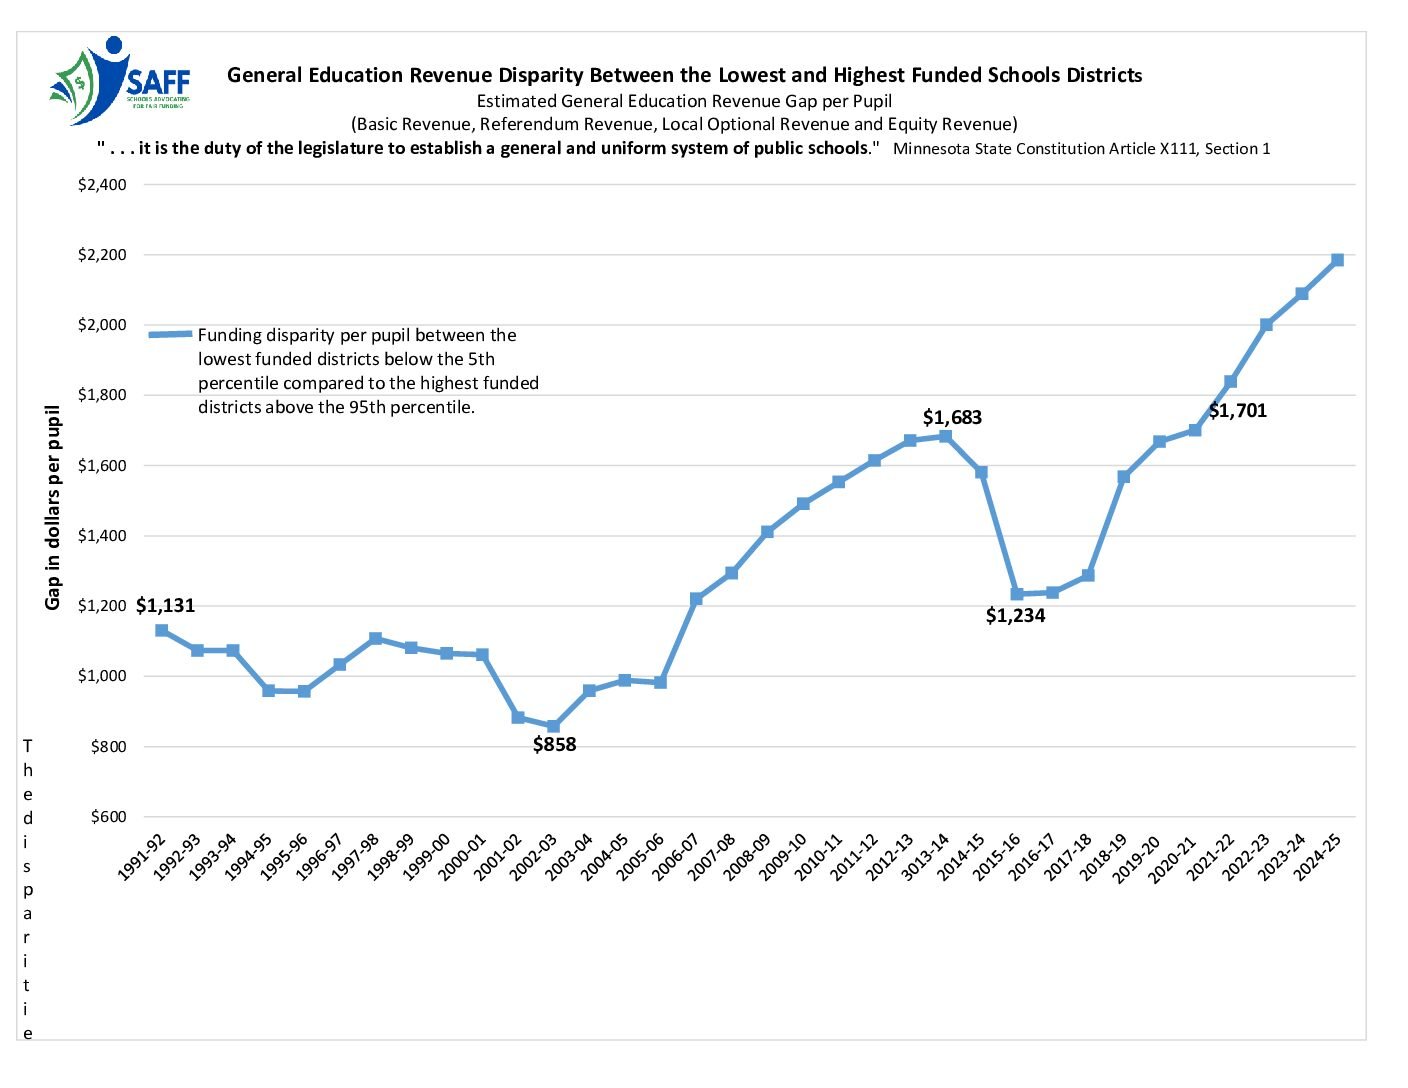
Revenue Disparity Between the Lowest and Highest Funded Schools Districts
The gap in funding between school districts is growing, and most of the growth is due to the disparities in operating levies ranging from $0 to $2,929 per pupil, FY2025
Significant Disparities in District’s Current School Levies
See each district’s operating levies (the school board-approved local optional revenue levy and any voter-approved referendum for all Minnesota school districts. The taxpayer cost for the operating levies is also included.
Revenue Rankings by District
For the 2026–27 school year, estimated total General Fund revenue among Minnesota school districts ranges from $10,897 to $30,070 per pupil unit, while General Education revenue ranges from $9,217 to $19,170 per pupil unit.
These differences reflect several factors, including state funding for districts with greater student needs, special education funding, and disparities in local school levy revenue. Differences in property wealth among school districts contribute to unequal tax burdens for taxpayers supporting school operating levies.
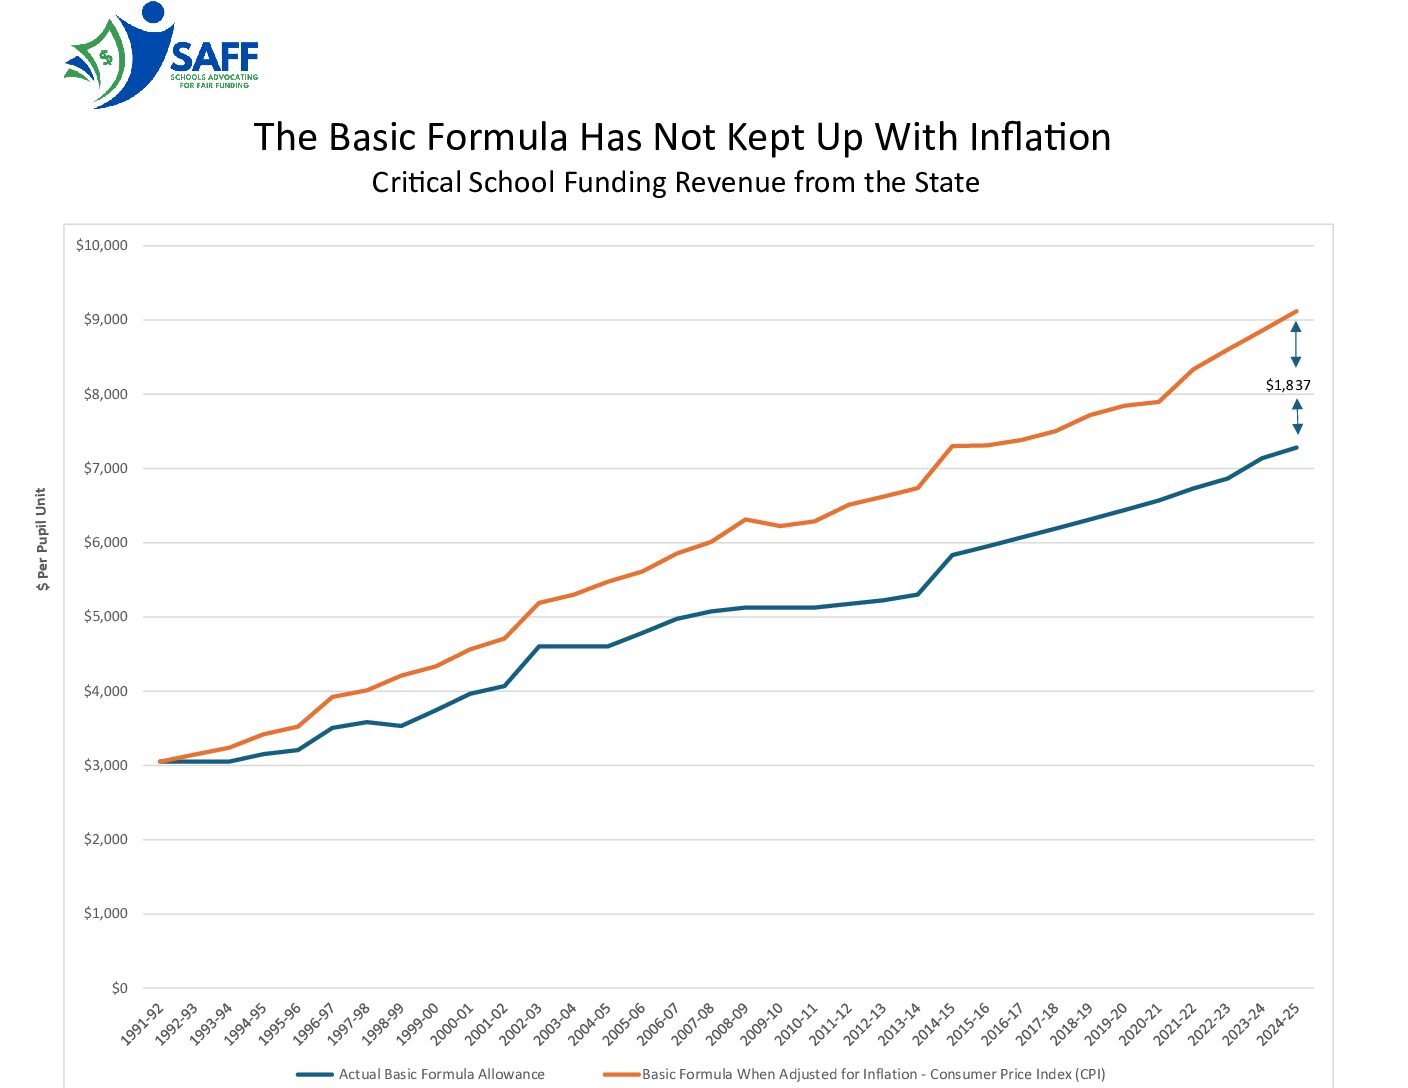
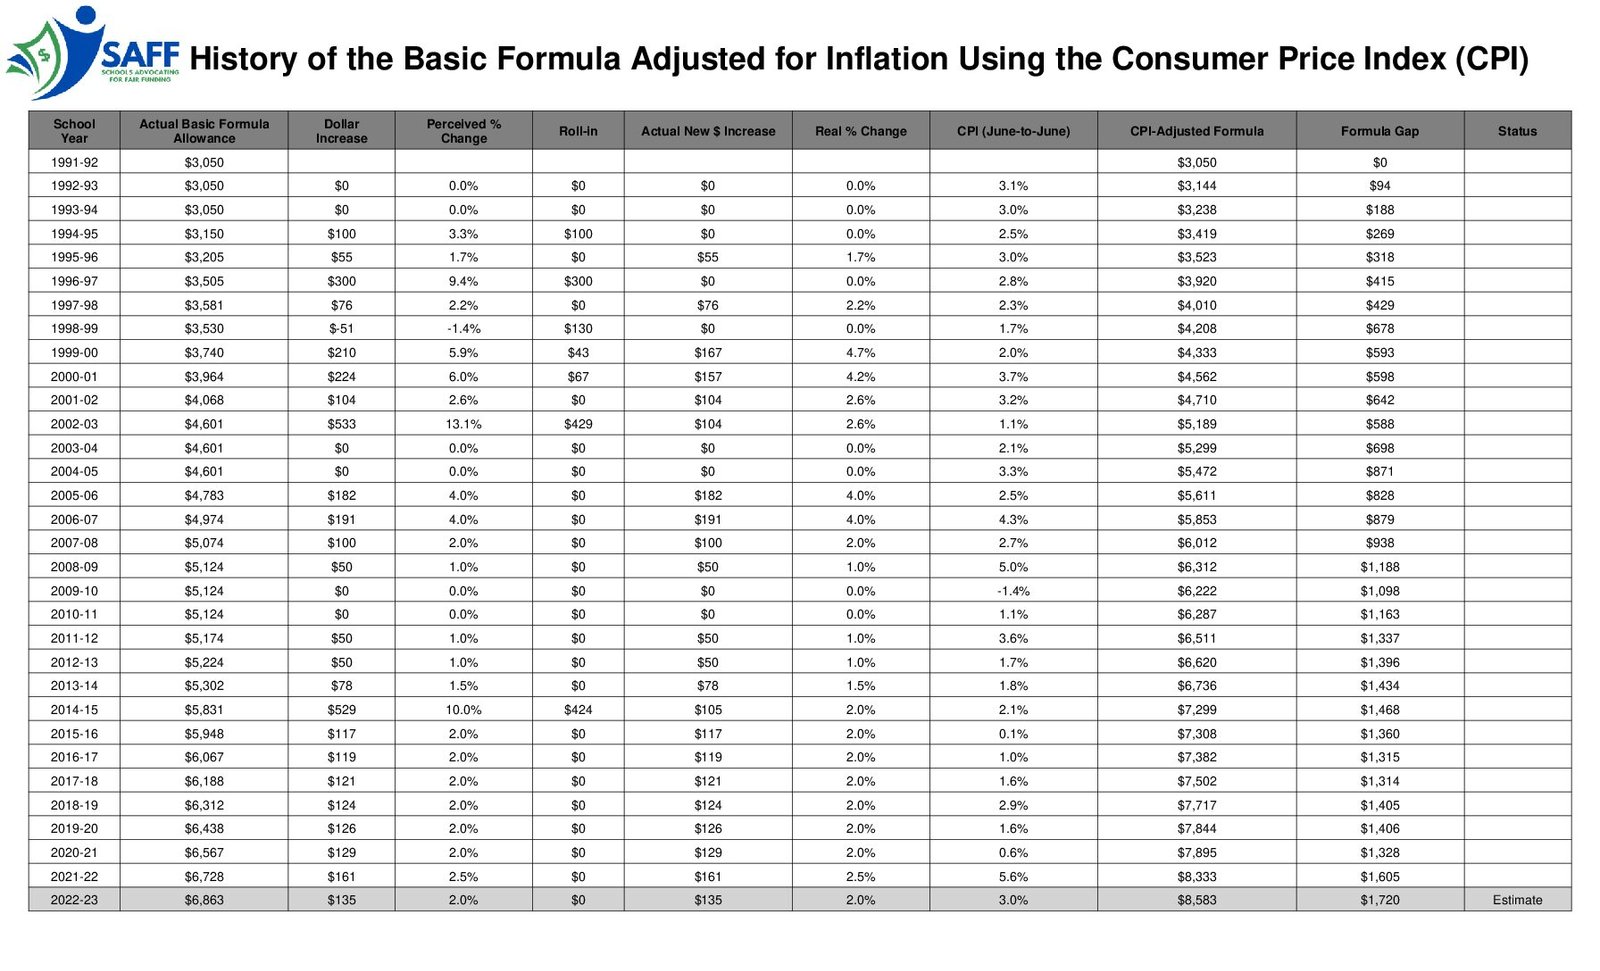
The Basic Funding Formula Has Not Kept Pace with Inflation
Despite steady increases in the basic formula allowance over the years, the revenue has consistently fallen behind inflation because annual adjustments have not been tied to the actual cost of living. Instead, increases have been made sporadically through legislative action, often driven by budget constraints and competing state priorities rather than a formula that keeps pace with inflation. As the history shows, when the formula is adjusted for the Consumer Price Index, the “real” buying power of the allowance has steadily eroded. The result is that in 2025–26, districts will receive $7,481 per pupil when the inflation-adjusted amount should be $9,342 — a gap of $1,861 per student. This persistent gap illustrates how the state’s funding system has shifted more of the burden onto local property taxpayers and made it harder for schools to maintain the same level of services and opportunities that were possible in the early 1990s.
Where Do You Live?
For the 2026–27 school year, the maximum referendum revenue amount is $2,366 per pupil unit, and districts may also receive up to $724 per pupil unit in Local Optional Revenue (LOR), for a combined maximum of $3,090 per pupil unit.
The actual amount of referendum and LOR revenue varies by school district. In addition, differences in each district’s property tax base mean that taxpayers can pay significantly different amounts on a $300,000 property to generate the same amount of revenue per pupil.
Minnesota’s National Ranking in School Funding
According to the U.S. Census Bureau’s 2024 school finance data, Minnesota ranks 31st nationally in total public school revenue relative to personal income, up from 36th in 2023.
The rankings compare how much states dedicate to public education for every $1,000 of personal income. States at the top of the chart devote a greater share of their residents’ total personal income to public school funding than states at the bottom.

Unfunded mandates stretch school districts thin.
The financial challenges of unfunded mandates
School districts want to meet the needs of all their students. When mandated services are underfunded, districts rely on the basic formula and school levies to make up for inadequate state funding.
- The Unfunded Cost of Special Education Services by District. The estimates are the most recent data for SY25 as of 10-1-25 (TOTAL SP ED AID) includes the state cross-subsidy reduction aid under M.S. 125A.76, subd 2e
- The Unfunded Cost for English Learning Services by District. The English Learner data are from the general education model as of the February 2025 forecast. The FY26 LEP expenditures are estimates.